Agile team leverages metrics as a reflection of how the scrum team delivers products through current Agile practices. Metrics are great to use for learning, innovation, and continuous improvements. It is important to know that metrics are team-based and should not be used to measured productivity, to compare teams or performance management.
SVPM scrum team follows the current Agile practices of leveraging Velocity and Sprint burndown chart as the measurement tools to illustrate the amount of work a team can completed in a sprint and forecasting.
Velocity is calculated at the end of the sprint by totaling the points for all fully completed and accepted user stories and is a trailing measure used to forecast future delivery. The historical view of the number of story points a team has completed sprint over sprint allows:
- The team to calculate the average velocity by using the story points delivered over the last six sprints
- The team to leverage their average velocity to enable sprint planning
- The average velocity can be used as a predictive measure for the team’s future delivery capacity
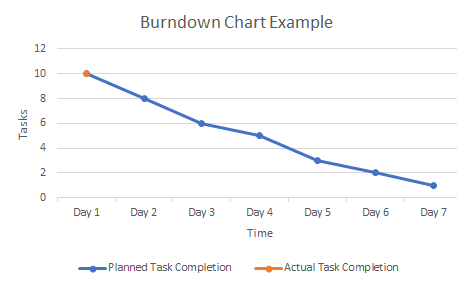
Sprint Burndown Chart
A burndown chart is a visual presentation of the rate at which work is completed and how much work remains in a sprint, measured in task hours or story points. The quantity of work remaining is shown on a vertical axis, while the time that has passed since beginning the project is placed horizontally on the chart, which shows the past and the future.
Using the burndown Chart as an effective education tool
The burndown chart is displayed to provide an updated status report on the progress of the Sprint. Having a visual representation of this most important data keeps everyone involved and encourages the team to deal with issues before they become problems. The goal of a sprint is to deliver a potentially shippable product increment, it’s important that all open stories are completed prior to the sprint review. Using the burndown chart to regularly evaluate sprint health helps to accomplish this goal.
The burndown chart is actively used in SVPM weekly standups to provide transparency to progress so the team can adapt and adjust during the course of the sprint. During the sprint, scrum team member reports story points and statuses on SVPM Slack channel every Monday and Friday, and in stand-up meeting every Wednesday. Then, the Scrum Master records the completed and remaining story points in its internal burndown chart, in an excel format. The burndown chart helps to answer the questions:
- Are we going to get to “done” by the end of the sprint?
- Are we encountering problems with delivering our stories?
Here are the key best practices to maintain a healthy burndown chart:
- Plan for capacity to address impediments and potential issues
- Plan for integration and dependencies and make them visible on the
- Ensure that the sprint goal is clearly defined and fully commit to the work
- Actively participate in the regular standups and record completed story points and progresses
- Communicate impediments and plans for the day so can complete the work early
- Avoid scope changes after the sprint has started
- Avoid bringing in additional user stories until all stories committed in sprint planning are complete
- Avoid deferring testing to the end of the testing

Great explanation on Burndown chart and velocity, Michelle.
By tracking the number of story points the team can complete as per the definition of done (DoD), sets a reliable pattern in predicting how long it will take them to complete new stories, It is Scrum Master’s responsibility to keep a velocity of the team. At the end of the sprint demo, Scrum Mater calculates number of points estimated for a story that was accepted/Done by the Product Owner and stakeholders.
Burndown chart and velocity complement each other. Burndown charts help maintain transparency in the organization that way following one of the three pillars Empiricism