Certified Business Coach and Corporate Exit Strategist
This is the second part of a three part article discussing “how does a project manager intelligently handle delays?”
Last article we focused on acknowledging the natural flow of a project which includes periodic speed bumps and roadblocks. In today’s article we’ll focus on using critical path analysis to assist with project management. Diagramming the critical paths of a project accomplishes several things:
- Identifies imaginary dependencies
- Highlights invisible bottlenecks
- Allows you to untangle the issues before they materialize.
Take a look at the below flowchart example:
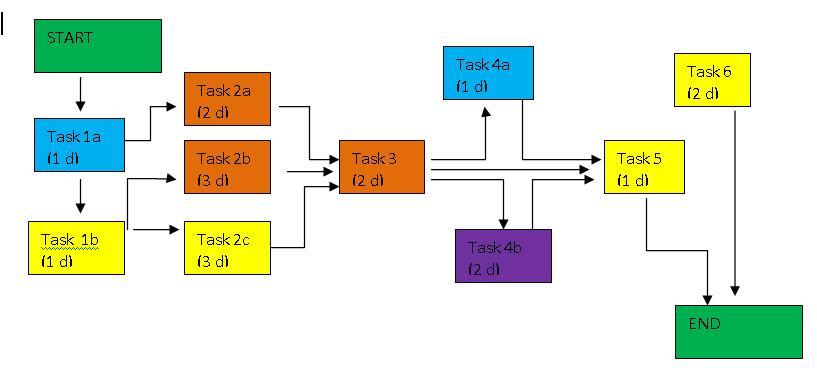
Critical Path Identification:
This flowchart illustrates a work flow by sorting which items can be conducted in parallel and which needs to be done serially (i.e. has some dependencies among them). By plotting out the parallel tasks in columns and the serial tasks in row, you forecast how long this current plan will take to execute. The longest time through each phase (or column) is the critical path time.
At first glance, you may think that it will take a maximum of :
1 day to execute phase Task 1 list; maximum of 3 days to execute phase Task 2 lists; maximum of 2 days to execute phase Task 3, 2 days for phase Task 4 lists, 1 day for Task 5 and 2 days for Task 6. This totals 11 days.
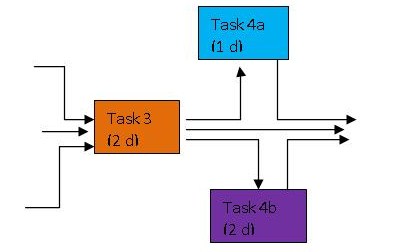
But from the above chart, you can see that there are three arrows going into and out of Task 3. Anytime you have three or more lines going to or from a single task, you have created a bottleneck. Task 3 cannot start it’s coding duties until all three of the previous tasks have completed and been delivered. Also, the rest of the team is in a ‘stop production’ mode until Task 3 is completed. This is something we need to ‘nip in the bud’ before any resources, design specifications and develop clocks are started.
Coding resource allocation in your Critical Path Charts:
Another helpful trick is to color-code your resources directly into your Critical Path Charts. In this example, each developer or resource has a different color assigned:

Once you have color-coded your critical path charts with your resources, you can now re-evaluate the time it will take your team to actually complete the phases. You now see that (although your original estimate was three days to complete phase Task 2 lists) it will take at least 5 days to get through the phase Task 2 iteration because Dave is assigned to both Task 2a and Task 2b. The tasks themselves are not dependent upon each other (and therefore could have been done in parallel), but Dave can only concentrate on one task at a time.
Once you have identified this issue, you can choose to:
- Add time to the schedule
- Assign one of the Tasks to another resource
- Split and isolate specialized functions into separate routines, and have other people (not familiar with that specific technology) just call those specialized macros or routines.
By color coding our resources, we can visibly see when we are under or over utilizing our people. We can quickly see that perhaps we can re-allocate some of Dave’s duties in phase Task 2 to Dianne.
Since we have already identified Task 3 as a potential bottleneck and risk, we can investigate splitting that task into mini-tasks and assign to Dianne or Deek.
But what if Dave is the only person that can do this work? Not to worry. There are still things we can investigate to untangle Dave from this resource bottleneck.
For instance: If Dave is the only person that has Sequel Server knowledge, then isolate all the Sequel Server items from the rest of Task 3 goals. Have Dave create re-usable subroutines in which Dianne and Deek can call upon to accomplish the rest of the activities. Dianne and Deek doesn’t need to know exactly how the database works underneath. They only need to understand the essence of what they are trying to accomplish with the code and use the proper function calls.
Identifying imaginary dependencies:
The last gift that critical path analysis presents us: highlighting imaginary dependencies. In this example, Task 6 is scheduled for the “end-game” of the project only because it isn’t needed until the end-game. But, once you map out the workflow and the true dependencies, you see that it isn’t actually dependent on any predecessors’ task. This is a great advantage to the project manager. He can now use this task when the project hits an unexpected delay or speed bump. When code is delayed, resources can be using that time to work on Task 6 without affecting the big-picture schedule or delivery dates. The 2-days it takes to setup Task 6 is already absorbed in the project plan. Therefore, you have essentially shaved 2 days in your schedule by moving up Task 6 and/or allocating other resources to it.
Conclusion:
This is just a quick review of how developers, testers and project managers can make good use of a color-coded critical path system. It’s a great way to map the workflows, identify imaginary dependencies, and highlight bottlenecks before a project even starts.
In the last three articles, we presented some tools to help the developer, tester and project manager to adapt to the natural flow of a development product life cycle. Once again, the trick isn’t to stay on track. The skill is to seamlessly get back on track when we wax and wane.
